python开发prometheus的exporter
2019-04-26

普罗米修斯监控指标分为四个类型:
- Counter
用于记录只会增加不会减少的指标类型,并且在程序重启的时候会被重设为0。
比如:采集http请求总数,cpu使用时间 - Gauge
用于记录可增可减的指标。
比如:采集可用内存大小 - Histogram
在指定分布范围内记录(如http request bytes)大小或者事件发生的次数。 - Summary
Summary和Histogram非常类型相似,都可以统计事件发生的次数或者大小,以及其分布情况。不同的是,它直接存储了分位数数据,而不是根据统计区间计算出来的。
python开发exporter可以参考https://github.com/prometheus/client_python
使用客户端自带的http_server实现
# coding=utf-8
from prometheus_client import start_http_server # ,Summary,Counter,Gauge,Histogram,CollectorRegistry
from prometheus_client.core import REGISTRY,GaugeMetricFamily #,CounterMetricFamily
import time
class MemCollector(object):
def collect(self):
with open('/proc/meminfo') as fd:
for line in fd:
if line.startswith('MemTotal'):
mem = float(line.split()[1].strip())
break
mem = float('%.2f' % (mem / 1024.0))
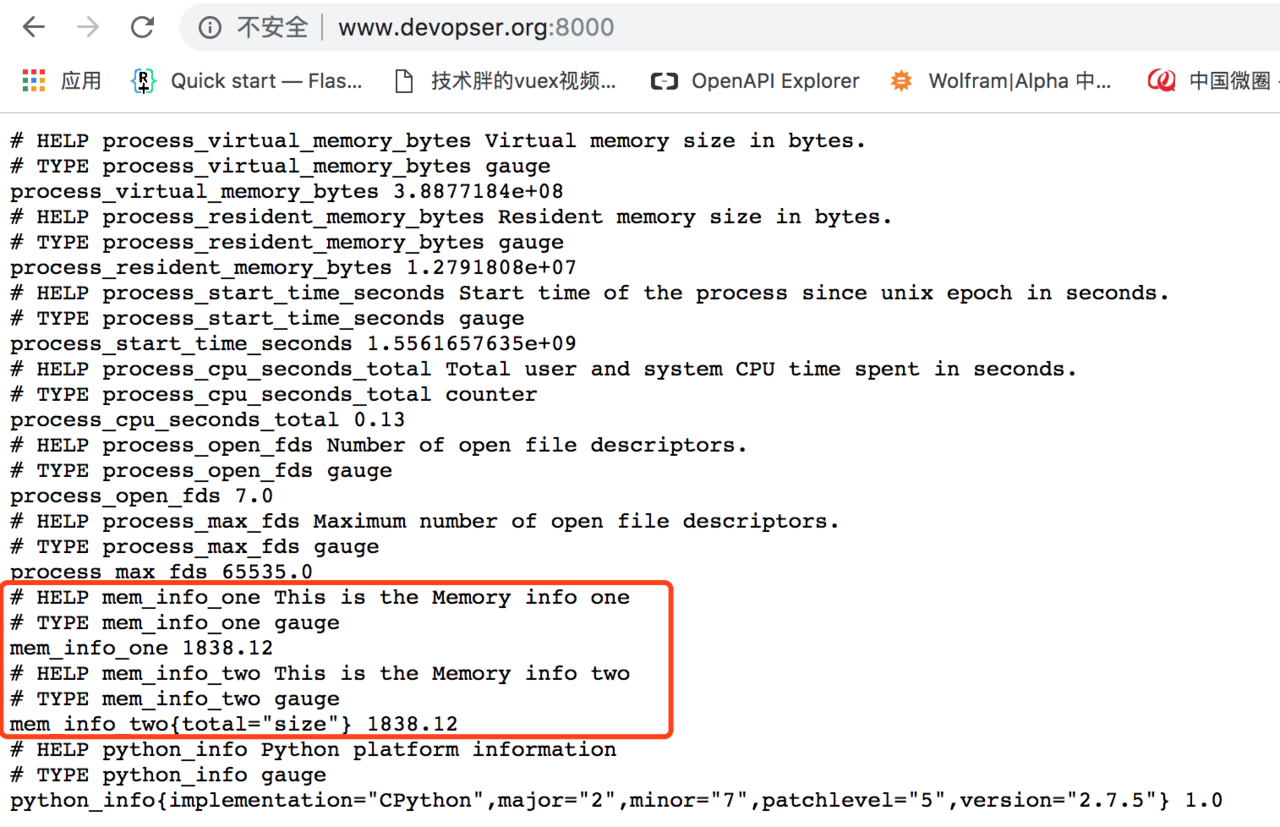
# 方式一
yield GaugeMetricFamily('mem_info_one','This is the Memory info one',value=mem)
# 方式二
g = GaugeMetricFamily('mem_info_two','This is the Memory info two',labels=['total'])
g.add_metric(['size'],mem)
yield g
REGISTRY.register(MemCollector())
if __name__ == '__main__':
start_http_server(8000)
while True: time.sleep(1)
访问结果
使用flask实现exporter
项目地址:https://github.com/fish2018/prometheus_exporter
标题:python开发prometheus的exporter
作者:fish2018
地址:http://devopser.org/articles/2019/04/25/1556165075790.html